
Let's make Business Intelligence
upscales your business!
Oops! Something went wrong while submitting the form.
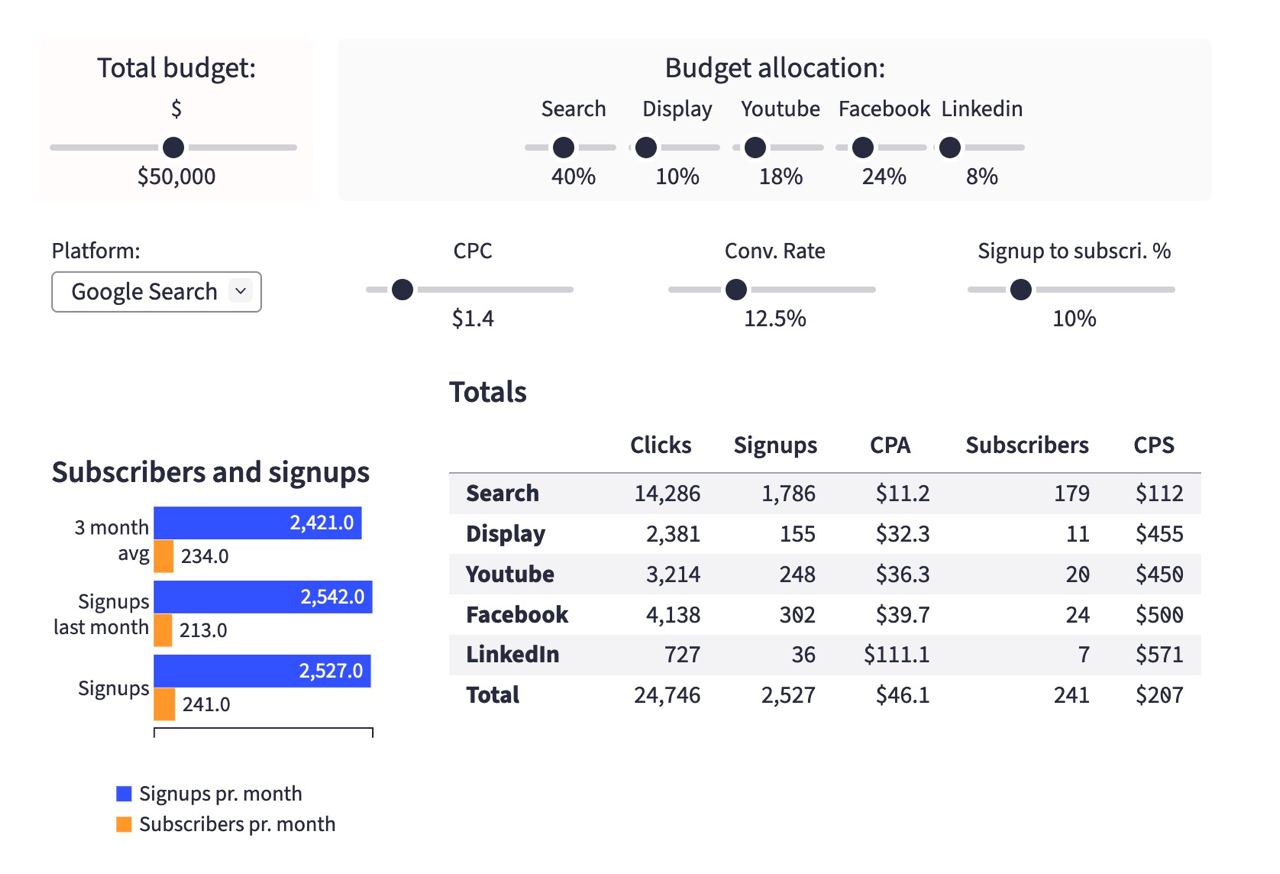
This chart helps allocate social media budget across Facebook, Google, YouTube, and LinkedIn. Users input budget and percentage allocation for each platform to estimate reach and engagement. It informs marketing teams to maximize reach and engagement.
This tool is designed to help marketing teams make informed decisions about how to allocate their social media marketing budget effectively and maximize their reach and engagement on each platform.
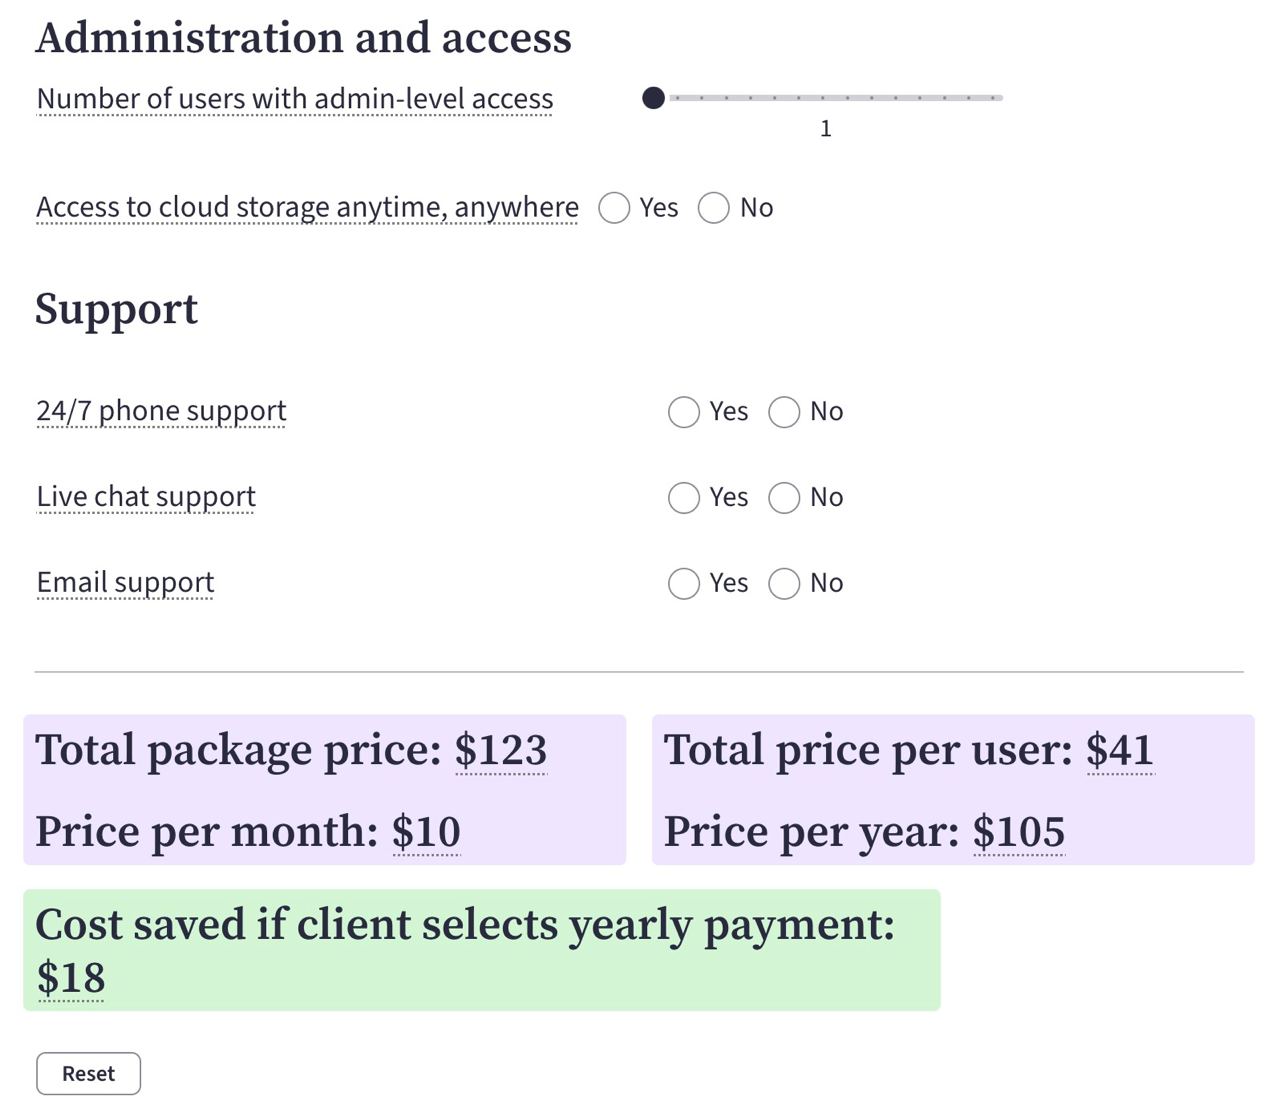
Acme is a software-as-a-service company specializing in cloud storage service. Acme's employees use this template to calculate the cost of the Enterprise package for their clients.
This tool is designed to help sales teams make informed decisions about how to price their Enterprise package effectively and maximize their profits while remaining competitive in the market.
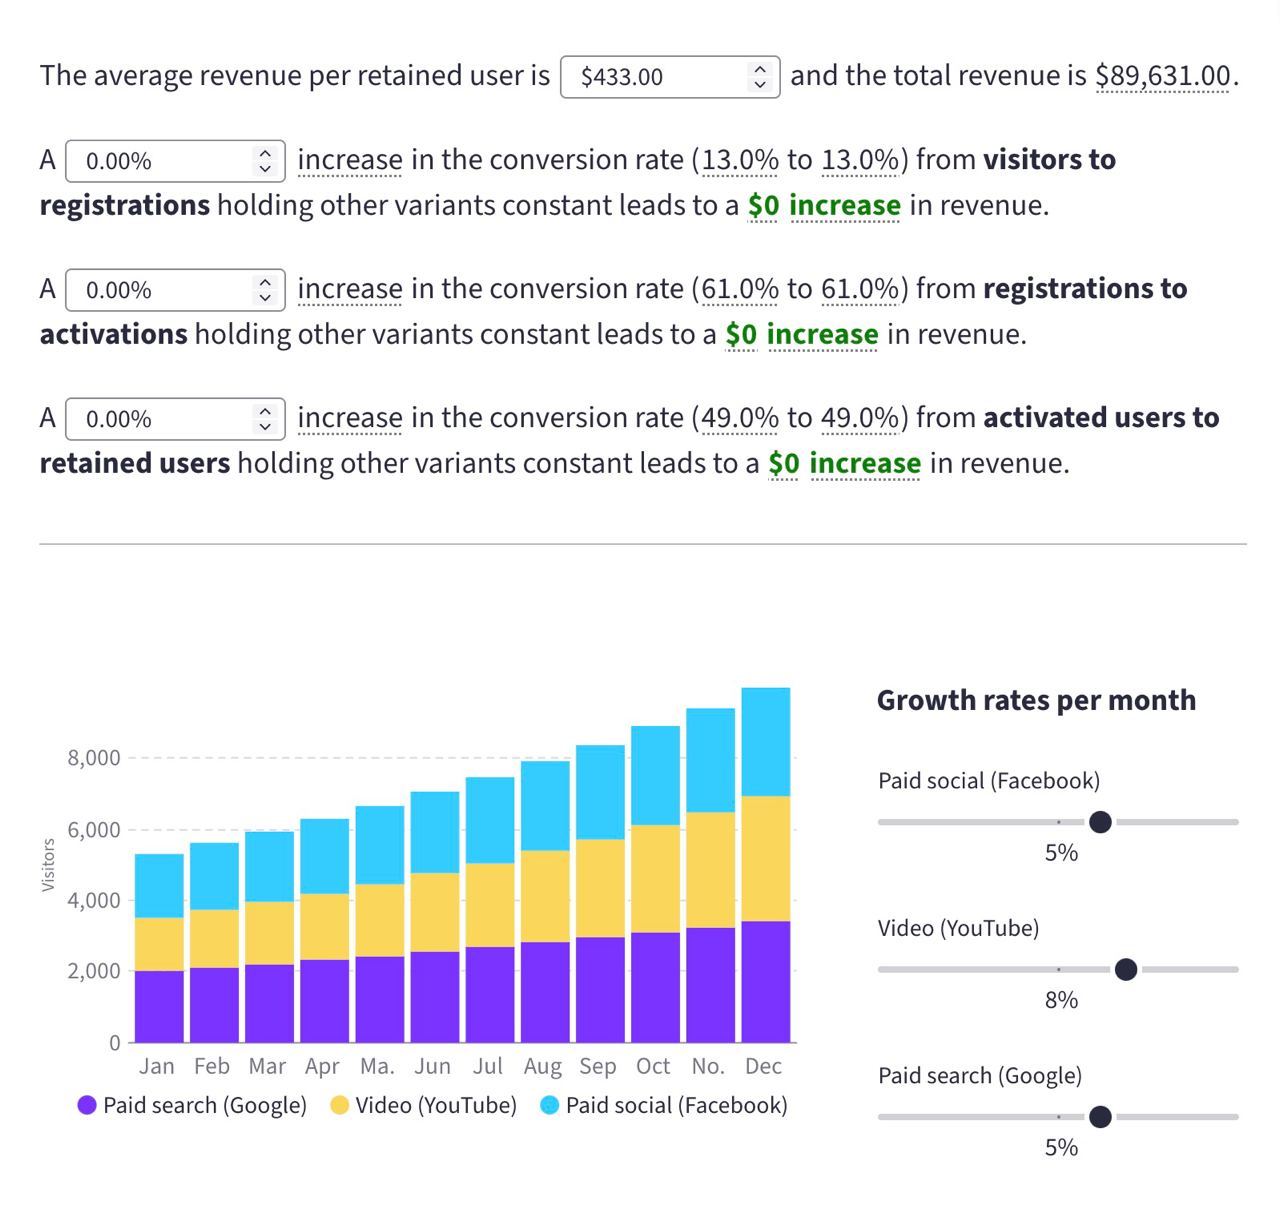
This interactive chart displays the user funnel analysis which allows users to explore the user journey and identify bottlenecks in the conversion process. By entering your actual numbers below, you can identify patterns and trends in the data, and make data-driven decisions to optimize your user experience and improve conversion rates.
The chart displays the conversion rate at each stage of the funnel, as well as the number of users at each stage. By hovering over each stage, you can see the percentage drop-off from the previous stage and the absolute number of users lost at each stage.
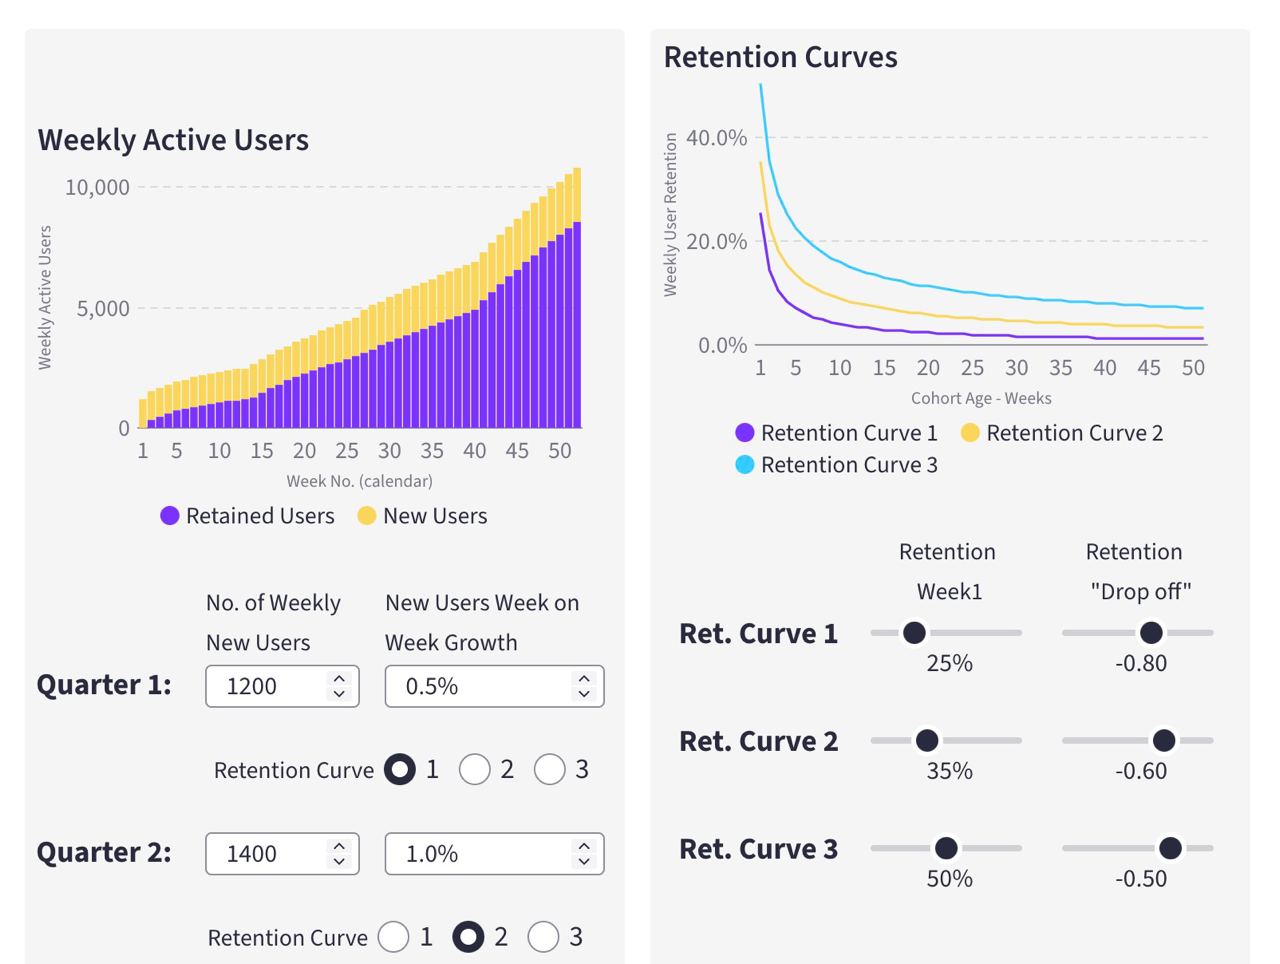
This is a tool designed to help Growth and Finance teams understand the mechanics driving the growth of their Active User base. By exploring the interaction between multiple variables, this tool by GRID enables teams to answer questions such as: If we want to reach X Weekly Active Users by the end of the year, where do our Acquisition and Retention metrics need to be at?
Because the interaction between these variables can be complex, GRID offers a visual way to analyze the data and gain insights into the most effective strategies for achieving growth targets.

An interactive Break-Even Analysis is an essential tool for entrepreneurs and business owners who want to determine whether their venture is financially viable. This analysis can help you calculate the minimum number of units you need to sell to cover all your costs and start generating a profit.
This tool by GRID is a powerful tool for entrepreneurs and business owners to assess their venture's financial viability.

This interactive chart displays the correlation between all acquired customers and revenue. It allows users to explore the relationship between these two variables and gain insights into the effectiveness of marketing spending in terms of customer acquisition and revenue generation.
By interacting with the chart by entering your actual numbers below, you can identify patterns and trends in the data, and make data-driven decisions to optimize their marketing spending and maximize revenue growth.
Enrich your leadership mindset with the latest power of Business Intelligence - your way for better decision making.

Enrich your leadership mindset with the latest power of Business Intelligence - your way for better decision making.